Bears Back in Town for Ethereum Thanks to a 3% Daily Dip (ETH Price Analysis)

Bears Back in Town for Ethereum Thanks to a 3% Daily Dip (ETH Price Analysis)
İçindekiler
Ethereum’s price has seemingly struck a significant obstacle following weeks of aggressive rallying. Yet, a further bullish continuation cannot be ruled out yet, as there are several support levels available to overturn the trend.
Technical Analysis
By TradingRage
The Daily Chart
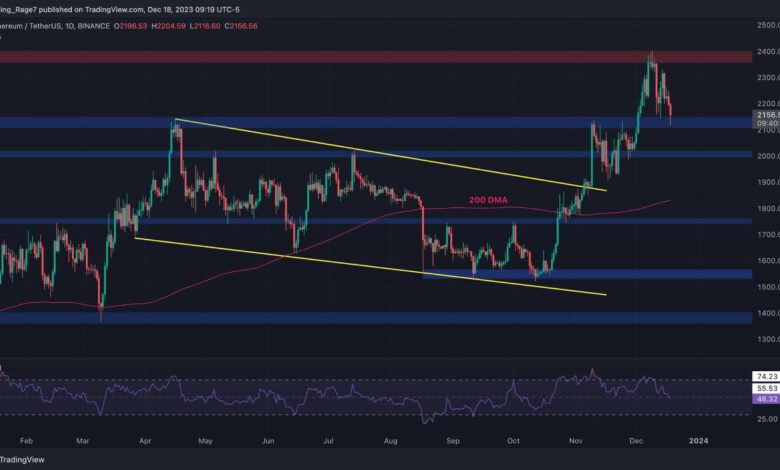
On the daily chart, it is evident that the price has been rising consistently after a rebound from the $1,500 support zone. The large bullish flag has been broken to the upside, and the market has tested the $2,400 resistance level.
However, this level has decisively rejected the price, leading to a drop toward the $2,100 support area. In case it holds, ETH will likely rally toward the $2,400 level and beyond. On the other hand, a breakdown could result in a deeper correction and even a potential retest of the 200-day moving average, located around the $1,850 price mark.
The 4-Hour Chart
Looking at the 4-hour timeframe, things look worrying for Ethereum. The market has been making lower highs and lows since the rejection from the $2,400 level, demonstrating a clear bearish shift in the short-term market structure.
Nevertheless, the trend is still bullish, as the trendline depicted on the chart is yet to be broken. If this happens, the mid-term trend will be considered bullish, too, and a deeper drop can be expected in the coming weeks.
Sentiment Analysis
By TradingRage
Ethereum Funding Rates
Ethereum’s price action has been significantly bullish over the past few weeks, with the cryptocurrency breaking back above the $2,000 mark. However, ETH has recently begun correcting, leaving market participants wondering whether the bullish phase is over or the market is simply going through a correction.
To answer the question above, evaluating the futures market sentiment would be beneficial. This chart demonstrates the funding rates, which is a useful futures sentiment metric. It depicts whether the buyers or the short-sellers are executing their orders more aggressively on aggregate. Positive values are typically considered bullish, while negative ones show pessimism amongst futures traders.
It is evident that the funding rates have been positive for quite some time now. However, the recent rates have been flying through the roof. This observation can be a bearish signal, as it points to the fact that the market might be very close to a long liquidation cascade. In case it happens, the price could plunge rapidly below the $2,000 level.
Binance Free $100 (Exclusive): Use this link to register and receive $100 free and 10% off fees on Binance Futures first month (terms).
Disclaimer: Information found on CryptoPotato is those of writers quoted. It does not represent the opinions of CryptoPotato on whether to buy, sell, or hold any investments. You are advised to conduct your own research before making any investment decisions. Use provided information at your own risk. See Disclaimer for more information.
Cryptocurrency charts by TradingView.